
计算机视觉-图像的基本操作
创始人
2025-06-01 13:21:20
图像的基本操作
- 1.读取图像
- 1.1代码实现
- 1.2两者的差异
- 2.创建图像缩略图
- 2.1代码实现
- 2.2两者的差异
- 3.绘制图像的轮廓与直方图
- 3.1代码实现
- 3.2运行结果
- 4.实现图像的灰度变换、直方图均衡化
- 4.1代码实现
- 4.2运行结果
- 5.实现图像的不同高斯模糊、计算导数
- 5.1代码实现
- 5.2运行结果
- 6.形态学计数(计算圆形个数等)、去噪
- 6.1代码实现
- 6.2运行结果
- 7.小结
1.读取图像
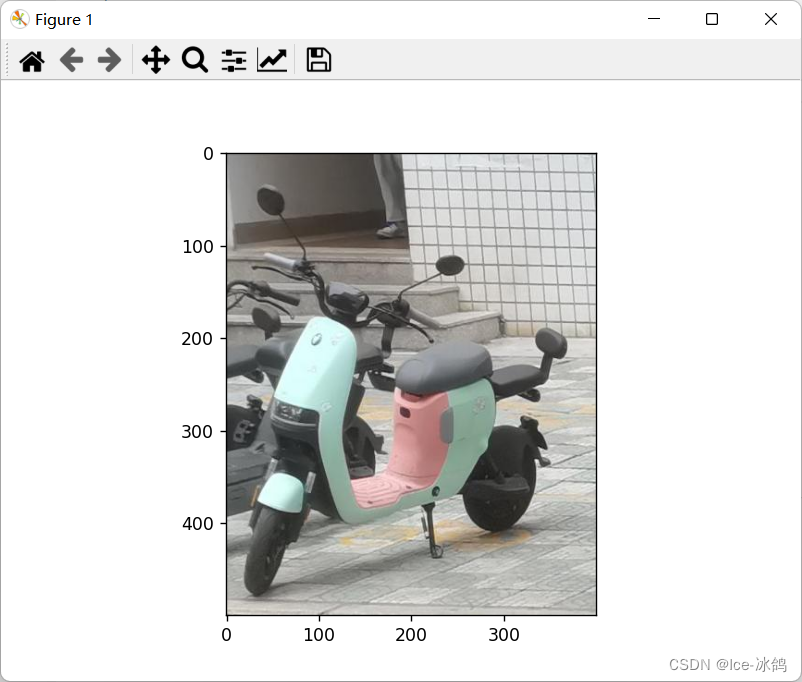
本实验分别使用PIL库和OpenCV库读取图像并实现可视化,并对比OpenCV读取和PIL读取的差异。
1.1代码实现
# Using PIL library
from PIL import Image
import matplotlib.pyplot as pltimg_pil = Image.open('001.jpg')
plt.imshow(img_pil)
plt.show()# Using OpenCV library
import cv2img_cv = cv2.imread('001.jpg')
cv2.imshow('image', img_cv)
cv2.waitKey(0)
cv2.destroyAllWindows()
先是PIL库的可视化:
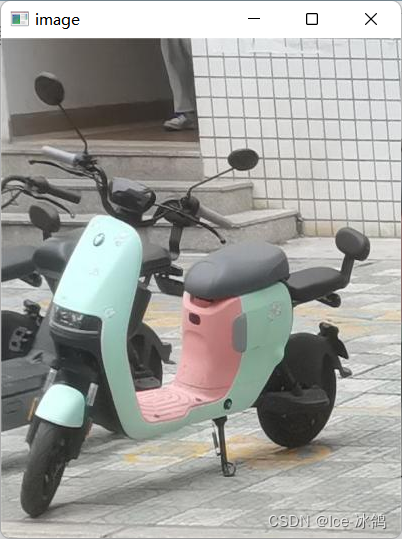
这是OpenCV库的可视化:
1.2两者的差异
- 颜色空间
PIL库默认使用RGB颜色空间读取图像,而OpenCV库默认使用BGR颜色空间读取图像。这意味着,如果我们使用OpenCV库读取图像并使用PIL库显示图像,图像的颜色可能会有所不同。 - 数据类型
PIL库使用的图像数据类型为PIL.Image,而OpenCV库使用的图像数据类型为NumPy数组。这意味着,如果我们想要在两个库之间传递图像数据,需要进行数据类型的转换。 - 图像大小
PIL库读取图像时会将图像缩放到适合显示的大小,而OpenCV库读取图像时不会自动缩放图像。因此,在使用OpenCV库显示图像时,我们需要手动调整图像的大小。
2.创建图像缩略图
2.1代码实现
# Using OpenCV library
import cv2img_cv = cv2.imread('001.jpg')
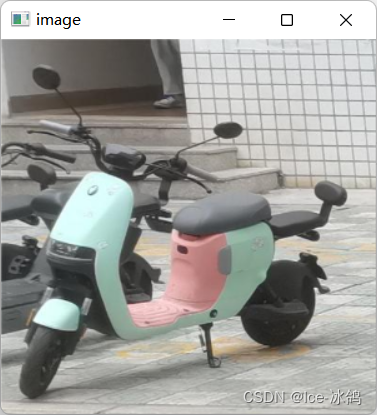
img_cv = cv2.resize(img_cv, (300, 300)) # resize image
cv2.imshow('image', img_cv)
cv2.waitKey(0)
cv2.destroyAllWindows()# create thumbnail
img_cv_thumbnail = cv2.imread('001.jpg')
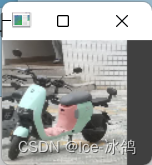
img_cv_thumbnail = cv2.resize(img_cv_thumbnail, (100, 100)) # resize image
cv2.imshow('thumbnail', img_cv_thumbnail)
cv2.waitKey(0)
cv2.destroyAllWindows()
先是resize
然后是thumbnail函数
2.2两者的差异
thumbnail()和resize()都是PIL库中的图像处理函数,可以用来改变图像的尺寸。它们的不同在于thumbnail()会保持图像的宽高比例,同时尽可能的缩小图像以适应给定的大小。而resize()则可以通过指定目标图像的宽度和高度来改变图像的大小,它不会保持图像的宽高比例。
3.绘制图像的轮廓与直方图
3.1代码实现
import cv2
import numpy as np
from matplotlib import pyplot as plt# 读取图像
img = cv2.imread('001.jpg', 0)# 绘制轮廓
edges = cv2.Canny(img, 100, 200)
plt.subplot(121), plt.imshow(edges, cmap='gray')
plt.title('Edge Image'), plt.xticks([]), plt.yticks([])# 绘制直方图
hist = cv2.calcHist([img], [0], None, [256], [0, 256])
plt.subplot(122), plt.plot(hist)
plt.title('Histogram'), plt.xlim([0, 256])plt.show()
3.2运行结果
这是该图片的轮廓和直方图:

4.实现图像的灰度变换、直方图均衡化
4.1代码实现
import cv2
import numpy as np
import matplotlib.pyplot as plt# 读取图像
img = cv2.imread('001.jpg', cv2.IMREAD_GRAYSCALE)# 灰度变换
img_gray = cv2.cvtColor(img, cv2.COLOR_GRAY2BGR)# 直方图均衡化
img_eq = cv2.equalizeHist(img)# 显示图像
plt.subplot(1, 3, 1)
plt.imshow(img_gray)
plt.title('Original')plt.subplot(1, 3, 2)
plt.imshow(img_eq)
plt.title('Equalized')plt.show()
4.2运行结果
以下是运行结果:

5.实现图像的不同高斯模糊、计算导数
5.1代码实现
import cv2
import numpy as np# Load image
img = cv2.imread('001.jpg')# Gaussian blur with kernel size 3x3
blur_3x3 = cv2.GaussianBlur(img, (3, 3), 0)# Gaussian blur with kernel size 5x5
blur_5x5 = cv2.GaussianBlur(img, (5, 5), 0)# Calculate derivatives using Sobel operator
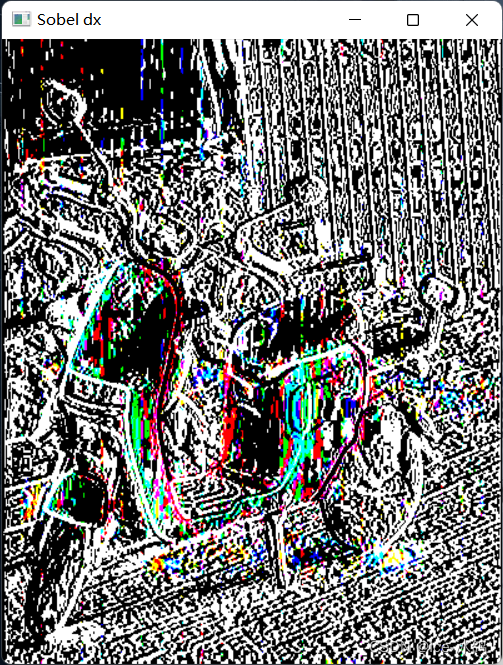
dx = cv2.Sobel(img, cv2.CV_64F, 1, 0, ksize=3)
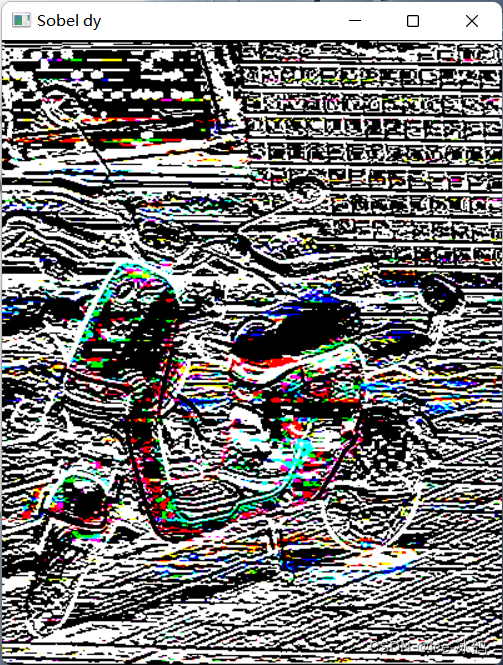
dy = cv2.Sobel(img, cv2.CV_64F, 0, 1, ksize=3)# Display results
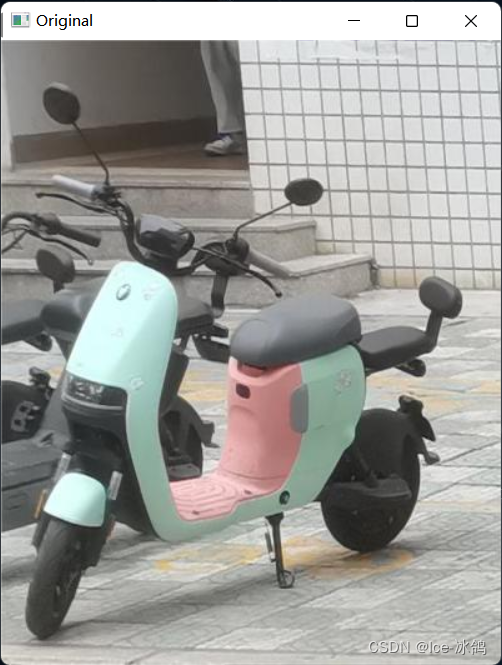
cv2.imshow('Original', img)
cv2.imshow('3x3 Gaussian Blur', blur_3x3)
cv2.imshow('5x5 Gaussian Blur', blur_5x5)
cv2.imshow('Sobel dx', dx)
cv2.imshow('Sobel dy', dy)
cv2.waitKey(0)
cv2.destroyAllWindows()5.2运行结果
原始图片
3×3高斯模糊

5×5高斯模糊

Sobel对x的梯度
Sobel对y的梯度
6.形态学计数(计算圆形个数等)、去噪
6.1代码实现
import cv2
import numpy as np# Load image
img = cv2.imread('001.jpg', cv2.IMREAD_GRAYSCALE)# Apply Gaussian blur to remove noise
blur = cv2.GaussianBlur(img, (5, 5), 0)# Apply thresholding to convert image to binary
_, thresh = cv2.threshold(blur, 0, 255, cv2.THRESH_BINARY_INV+cv2.THRESH_OTSU)# Apply morphological operations to remove noise and fill holes
kernel = np.ones((3,3), np.uint8)
opening = cv2.morphologyEx(thresh, cv2.MORPH_OPEN, kernel, iterations=2)
closing = cv2.morphologyEx(opening, cv2.MORPH_CLOSE, kernel, iterations=2)# Find contours and draw them on the original image
contours, hierarchy = cv2.findContours(closing, cv2.RETR_EXTERNAL, cv2.CHAIN_APPROX_SIMPLE)
cv2.drawContours(img, contours, -1, (0, 0, 255), 2)# Count the number of circles
circles = cv2.HoughCircles(closing, cv2.HOUGH_GRADIENT, 1, 20, param1=50, param2=30, minRadius=0, maxRadius=0)
if circles is not None:circles = np.round(circles[0, :]).astype("int")print("Number of circles:", len(circles))
else:print("No circles found")# Display the result
cv2.imshow('Result', img)
cv2.waitKey(0)
cv2.destroyAllWindows()
6.2运行结果
高斯去噪后在原图上画出轮廓

命令行输出

从上面的轮廓图就可以看出本图没有圆形轮廓,所以计数应该是0。
7.小结
本次实验主要使用了OpenCV库对图像进行处理,包括读取、可视化、缩略、变换、绘制轮廓和直方图、灰度变换、直方图均衡化、高斯模糊、计算导数、形态学计数和去噪等应用。OpenCV库适合用于计算机视觉应用程序,可应用于图像分析和处理。
相关内容
热门资讯
搜索量暴涨超600%!年夜饭有...
春节期间,不想亲自下厨怎么办?今年春节,年夜饭送到家、年夜饭外卖成为很多人的新选择。 数据显示,相比...
吕梁首届国际气球艺术展开展
春节假期想找好玩又出片的好去处?不妨来城南公园,打卡这场梦幻气球展览。2月14日,吕梁首届国际气球艺...
原创 埃...
埃及,这个横跨亚非两大洲的国度,地理位置的独特性让它在全球范围内有着重要的战略意义。这里的苏伊士运河...